If you are here hoping to learn more about using Graylog for the purpose of monitoring the security posture of your organization, strap in – it's about to get real.
In this series of posts, I will share how we have historically leveraged Graylog's Pipeline capability to implement various threat detection rules to provide a SIEM-like functionality to this popular log aggregation tool.
Let me first state that Graylog Enterprise has a lot to offer as an out-of-the-box SIEM solution due the the presence of a correlation engine and other top-tier features; however, we primarily leverage the open source version which requires some DIY in order to cover basic SIEM functions. This blog series covers years' worth of DIY lessons learned. Also, we developed most of this approach while using Graylog 3.x, but I expect most, if not all, of it to be forward compatible with newer versions.
What are Pipelines?
Who better to explain this than Graylog's own product manager? Check out this webinar where Nick Carstensen explains Streams & Pipelines. Another mandatory read on the topic are the Graylog docs themselves.
To put it simply, pipelines are channels that your logs flow through, allowing you to perform additional processing against your logs before they are written to the Elasticsearch backend. They are a collection of rules executed in order.
A COLLECTION OF RULES
Within your pipelines, you define rules that will be applied to each message that passes through it. A rule consists of a condition and an action to take if that condition is met. Essentially, "if this, then do that." See below for a very simple example of a pipeline rule.
rule "example_rule"
when
	// if these conditions are met
then
	// do these things
end
There are many conditions you can look for such as the presence of a field, or a string being contained inside of a message field.
You can also daisy chain various conditions using Boolean logic, allowing for very specific conditions. From the docs:
Expressions support the common boolean operatorsAND(or&&),OR(||),NOT(!), and comparison operators (<,<=,>,>=,==,!=).
The primary thing to understand is that you want the entire when block to evaluate as true in order for the then block to take effect. You may need to group certain conditions for nested logic, such as the list of cidr_match functions below.
rule "enrichment_rfc1918_dst_ip"
when
    // only process events with a dst_ip field
    has_field("dst_ip")
    AND
    // check if rfc1918, only one of these must be true
    (
        cidr_match("10.0.0.0/8", to_ip($message.dst_ip))
        OR
        cidr_match("172.16.0.0/12", to_ip($message.dst_ip))
        OR
        cidr_match("192.168.0.0/16", to_ip($message.dst_ip))
        OR
        cidr_match("127.0.0.0/8", to_ip($message.dst_ip))
    )
then
	set_field("dst_ip_is_internal", true);
end
In the example above, so long as everything between lines 2 & 16 evaluates as true, the message will now have an additional field of src_ip_is_internal set to true.
Now that we have a src_ip_is_internal field, we can later on use it in downstream pipeline rules or even in our threat hunting queries. For example, quickly looking for RDP connections from outside of the local area network: dst_port:3389 AND NOT src_ip_is_internal:true. The reason I used a NOT condition in the query, is that only events that evaluated as true will have this field at all. That means there is no such thing as src_ip_is_internal:false, only the absence of the field altogether. It would be handy if there was an else option to catch all others, but unfortunately there is not.
EXECUTED IN ORDER
Pipelines are broken into stages to determine when a set of rules will be applied. Imagine the simple example below of 3 pipelines with 3 stages, a set of rules in each stage. As events enter each pipeline, they are processed by every rule in each stage, and then passed to the next stage in the pipeline.
The primary reason you would separate rules into different stages is when one rule depends on the completion of another. The most common situation for this is needing to normalize your logs so that subsequent rules can expect a consistent naming convention for all fields.
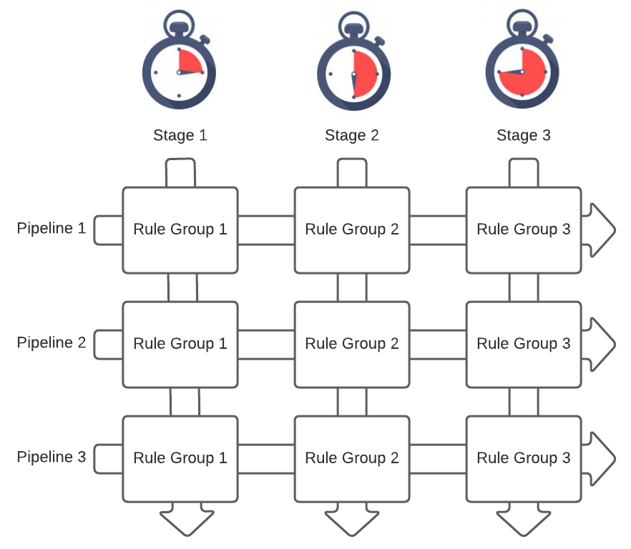
Messages entering pipelines at the same time are processed through each stage in parallel, meaning that stage 1 of pipeline 1 is executed at the same time as stage 1 of pipeline 2. This is an important concept to grasp to better understand how we turn this into an enrichment + threat detection engine.
Another important thing to understand about stages in a pipeline is that if a message does not evaluate true for any of the rules in a particular stage, the message will not progress to subsequent stages in that same pipeline. This was not always desirable for us, so we use a small hack to change this behavior as needed which I'll explain later in this series.
FIRST AND MOST IMPORTANT USE CASE: NORMALIZE YOUR LOGS
A very common problem that can be solved with pipelines is normalization of your logs. Despite there being well-known standards, log sources vary wildly in format and schema. This makes it difficult to run standard queries for things such as a specific source IP when that field may appear many different ways depending on your logs: source_ip, srcip, src_ip, originatingIp, etc. Therefore, a simple pipeline rule may exist in order to rename all of these similar fields into a standard field name. We call this process normalization.
Before you can build pipeline rules to normalize your data, you must first adopt a normalization strategy. There is no right or wrong approach here--it's a per-organization decision for the most part. However, I strongly recommend familiarizing yourself with some well-known models that already exist such as OSSEM by Roberto Rodriguez (@Cyb3rWard0g).
Here is a condensed example of a pipeline rule that exists solely to normalize events coming from a Fortigate firewall. Notice we are renaming many fields according to our own internal normalization standard. We are also removing fields that are not valuable to us. In this example, we are removing the geoip_* fields sent by the firewall, because we add our own GeoIP data in a standardized way in subsequent pipelines. You may choose to remove many other fields that are less likely to provide long-term value. Lastly, we are setting (creating) a new field for each event event_type:firewall which makes firewall related queries very simple later on.
rule "normalize_fortigate"
when
	// only run this rule on events with event_type:fortigate
	has_field("event_type") AND
	contains(to_string($message.event_type), "fortigate"
then
	rename_field("appcat", "category"); // used in application logs
	rename_field("catdesc", "category"); // used in url logs
	rename_field("dstip", "dst_ip");
	rename_field("dstport", "dst_port");
	rename_field("logdesc", "event_desc");
	rename_field("srcip", "src_ip");
	rename_field("srcport", "src_port");

	remove_field("geoip_city_name"); // remove in favor of our own geoip data
	remove_field("geoip_continent_code");
	remove_field("geoip_country_code2");
	remove_field("geoip_country_code3");
	remove_field("geoip_country_name");

	set_field("event_type", "firewall");
end
Each of the actions being taken inside of the then block is based on one of the many defined pipeline functions that can be used. There are many functions that allow you to assess and manipulate data in your events.
We have a rule just like the one above for every unique log source that we ingest data from. These are the first rules (Stage 0-10) that are applied to all incoming messages, and are the foundation of all other pipeline rules that come after.
Check out a start-to-finish example of ingesting and normalizing Cylance Protect logs
Once your most commonly used field names are normalized, then you can move onto more interesting use-cases for pipelines such as Geolocation of IP addresses, checking IPs/domains/hashes against common threat intelligence lists, looking for suspicious command line activity, and many others.
In the next posts of this series, I will break down exactly how our enrichment and threat detection pipelines are structured. Lastly, I will cover how we generate actionable alerts that account for asset value as well as threat severity.